|
The MeteoViewer uses the data that are received with with the
MeteoCom. This program is
free and is given as an example for the
MeteoTools,
a Program-Library for the preparation of the meteo data (Software developer can find more on the
Developer-Plattform).
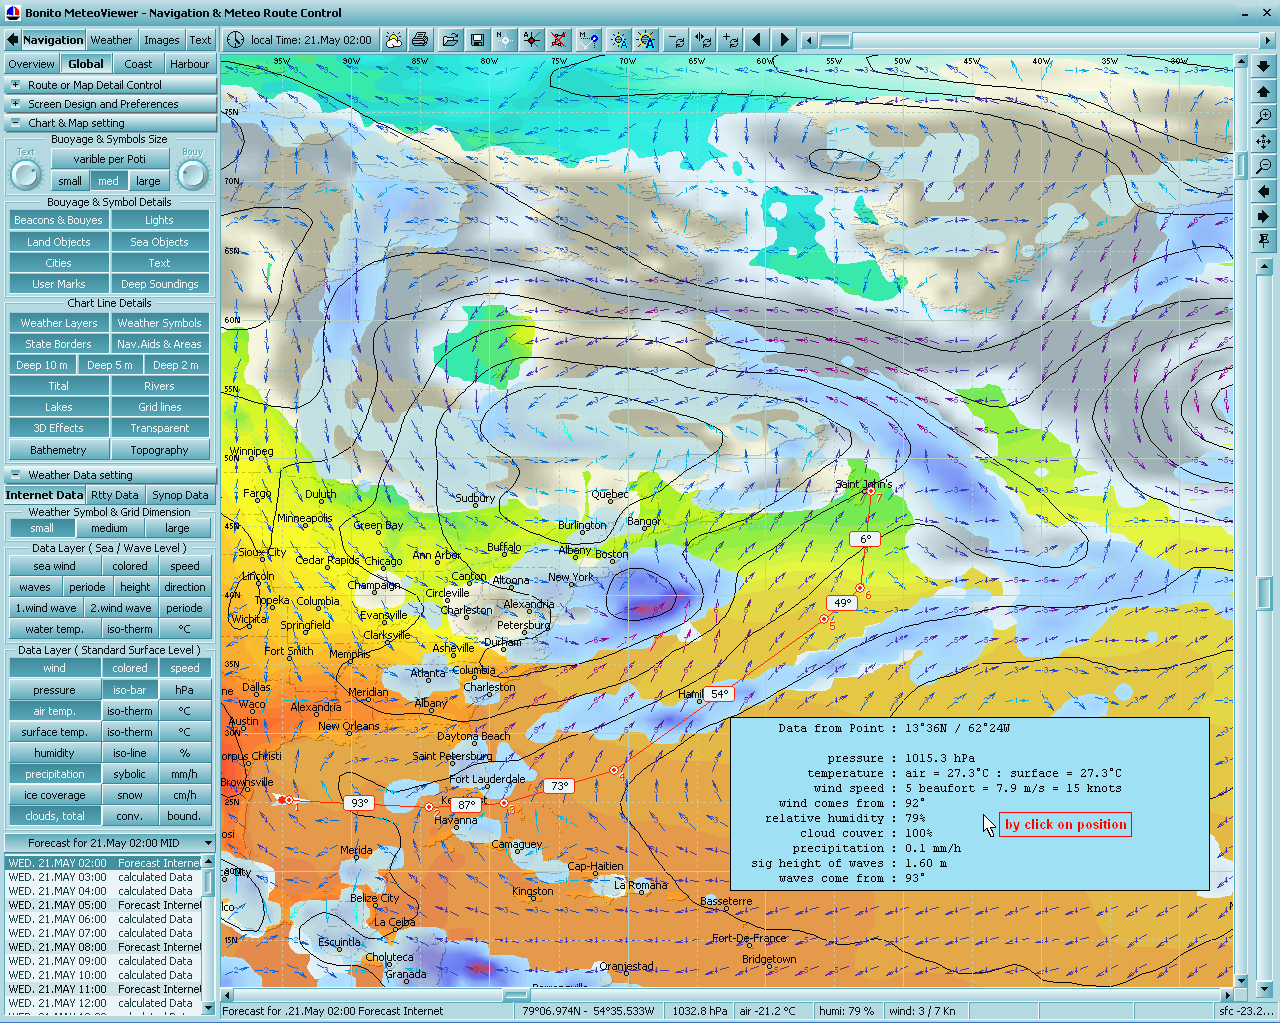
With the MeteoViewer the downloaded data from the internet is
visualised. The received data from the radio is viewed in the
same manner. The MeteoViewer has four sections and are called Weather, Navigation, Images and Text. They are explained in the followingt:
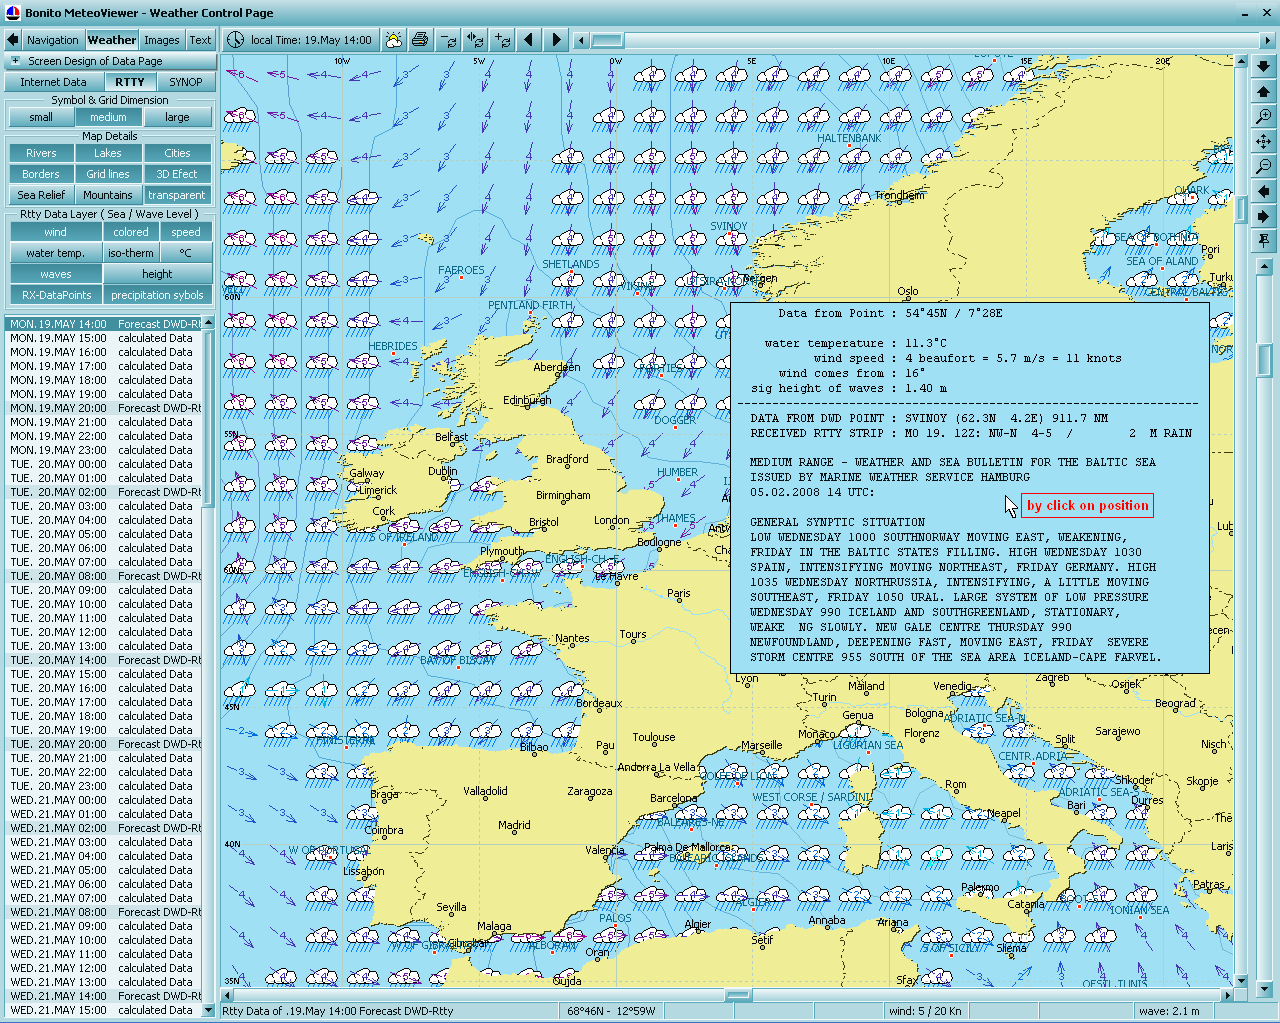
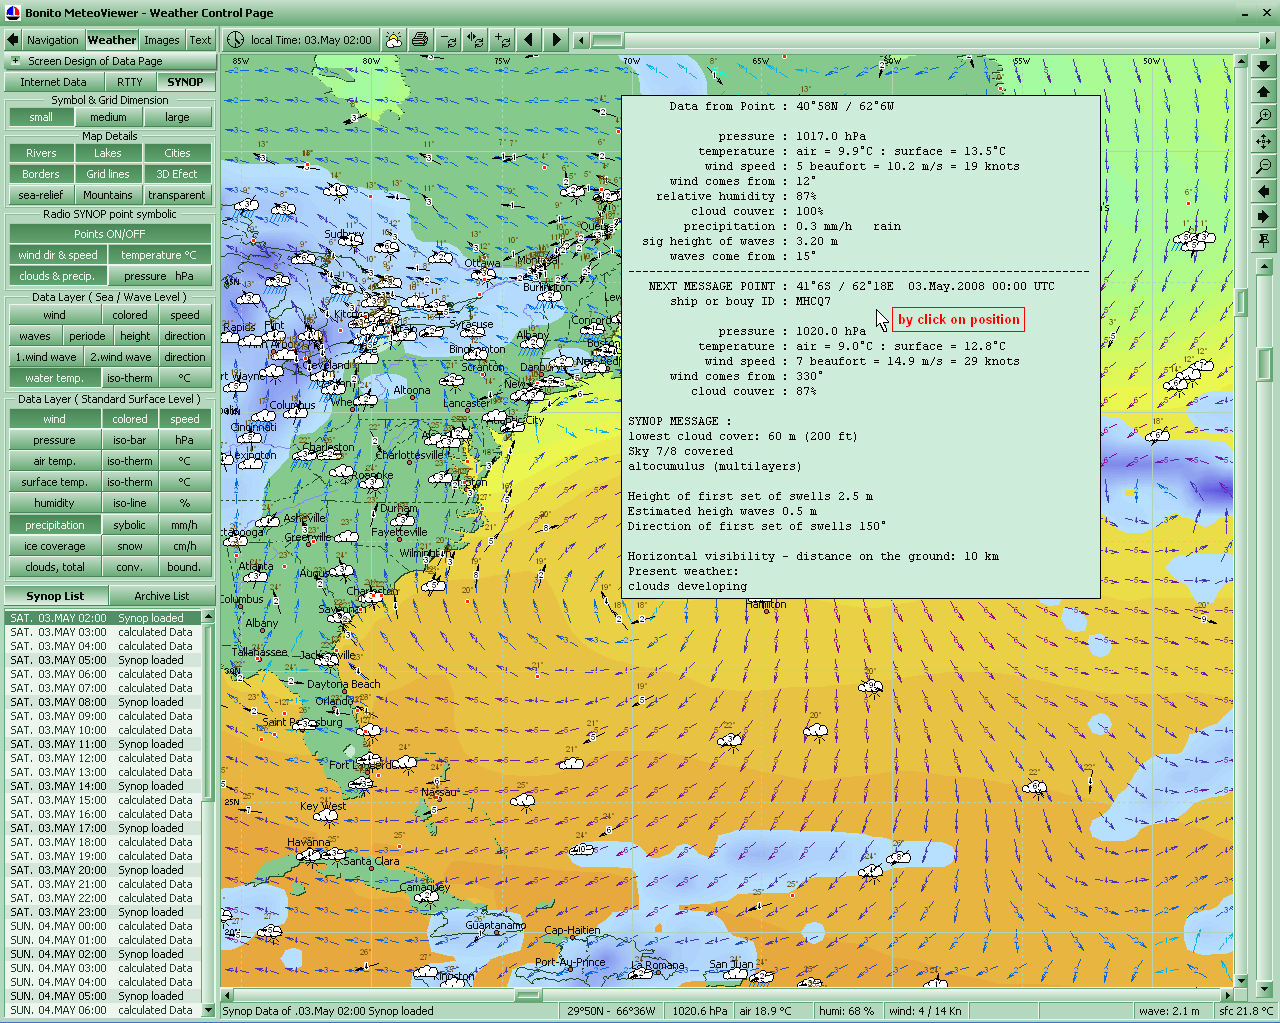
Weather

Here the data is processed that was downloaded
from the internet with the MeteoServer or as synop data from the
radio.
All possible displays of the parameters can be combined.
Remarkable is the smooth flowing of the resolution of the
data-grid-points for example the spacing between the single wind
arrows. Zooming down to the planks of the harbour is metrological
nonsense because zooming does not heighten the resolution because
nobody in the world can make such a calculation that is better
than a meteo computer centre not even the largest computer can do
this, so why do people believe in the stupid talk of some data
producers that say they can do it better, in any case Bonito can
not do this either, so always use the visualisation large enough
so you can what could come from where to your location. Further
zooming on to a point will only bring exacter details. The
metrological fault rate is so large that for example an exacter
position of a rain border over a certain position is proportional
to the fault rate. The MeteoViewer only shows this in a better
resolution so does not do any metrological fortune telling.
Although the internal calculator takes into consideration certain
topographic facts only the scientific consequences are followed
for example a wind cannot blow through a hill even if the wind
arrows show this phenomenal the worth’s are shown as they would
have been theoretically if every thing had been flat. This might
be of importance to Para gliders but I hope that the spippers do
not want to sail in the hills because the MeteoViewer is made
especially for the marine.
The following combined data can be displayed:
-
Wave height and direction Waves are displayed as a coloured
line for the marking of the danger zones.
-
Wind, SeaWind strength and direction.
The wind arrows
can be
coloured for marking the danger zone.
-
Temperature for air for ground and for water
also displayed as a line, Isotherm.
-
Air pressure,also displayed as a line, Isobars
-
Humidity also displayed as a line.
-
Precipitation and the amount as well as type
as a symbol like rain,
hale, thunderstorm, snow.
-
Clouds, convective and / or boundary.
-
Ice and snow coverage.
The most exciting is the animation. The future
weather is displayed as a film on your screen. While you can
change the display by zooming or shifting. This way you can see
what is coming and if you are going to have a good time or a bad
time and are better off staying in port. |
|
Navigation - MeteoRoute-Control
This is a complete sea chart program, with all
usual details and functions, which are updated over Internet (like
the weather). A world novelty is however meteorological route
control. You see a colored route, which is colored by the
weather over the way time on the map. Thus can be recognized
fast and clearly, when to which time, which route section makes
problems - or also not.

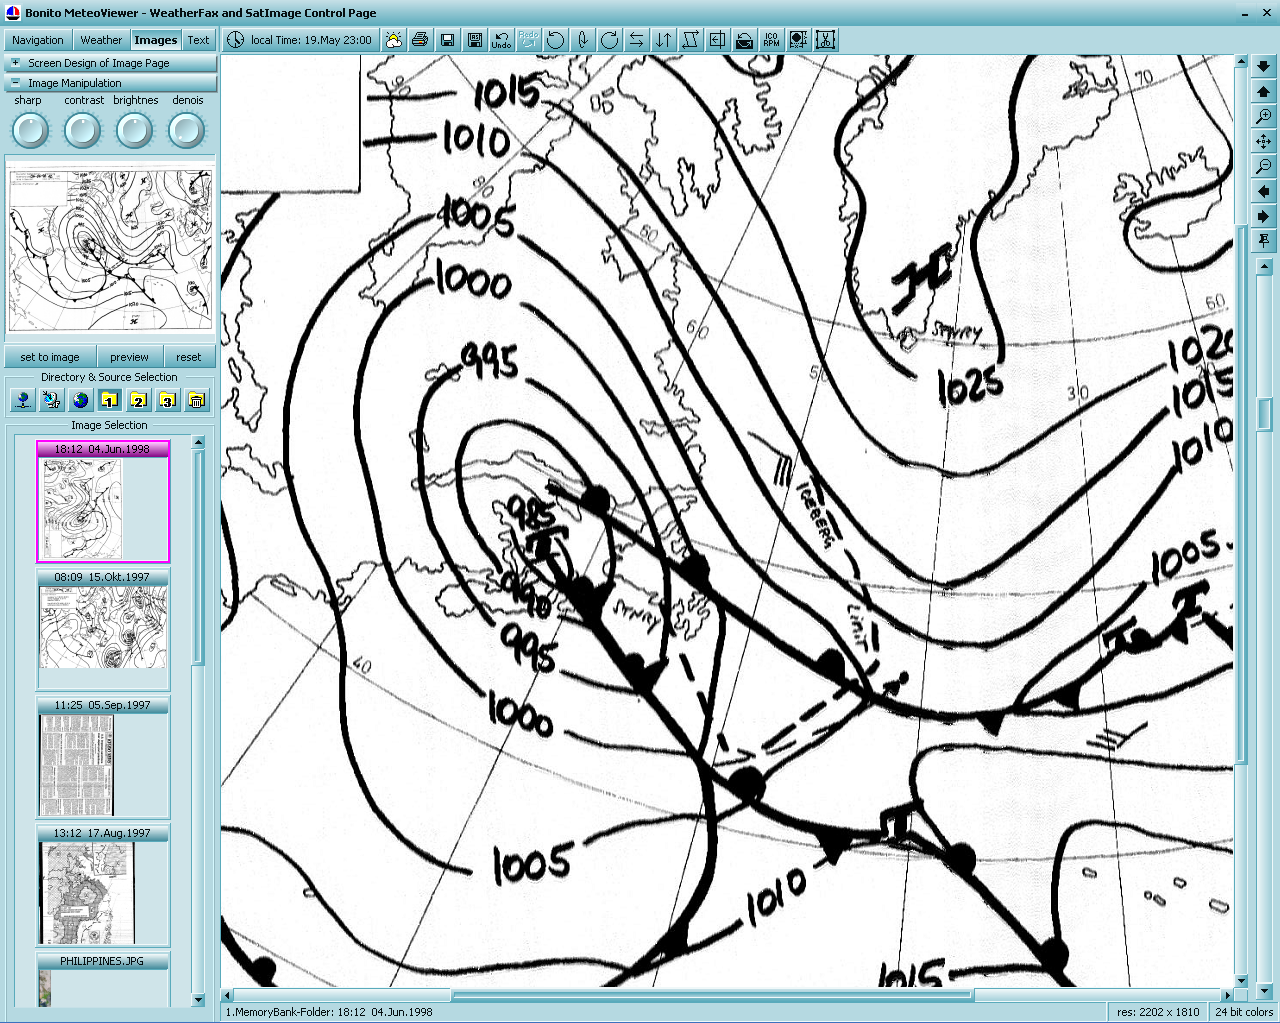
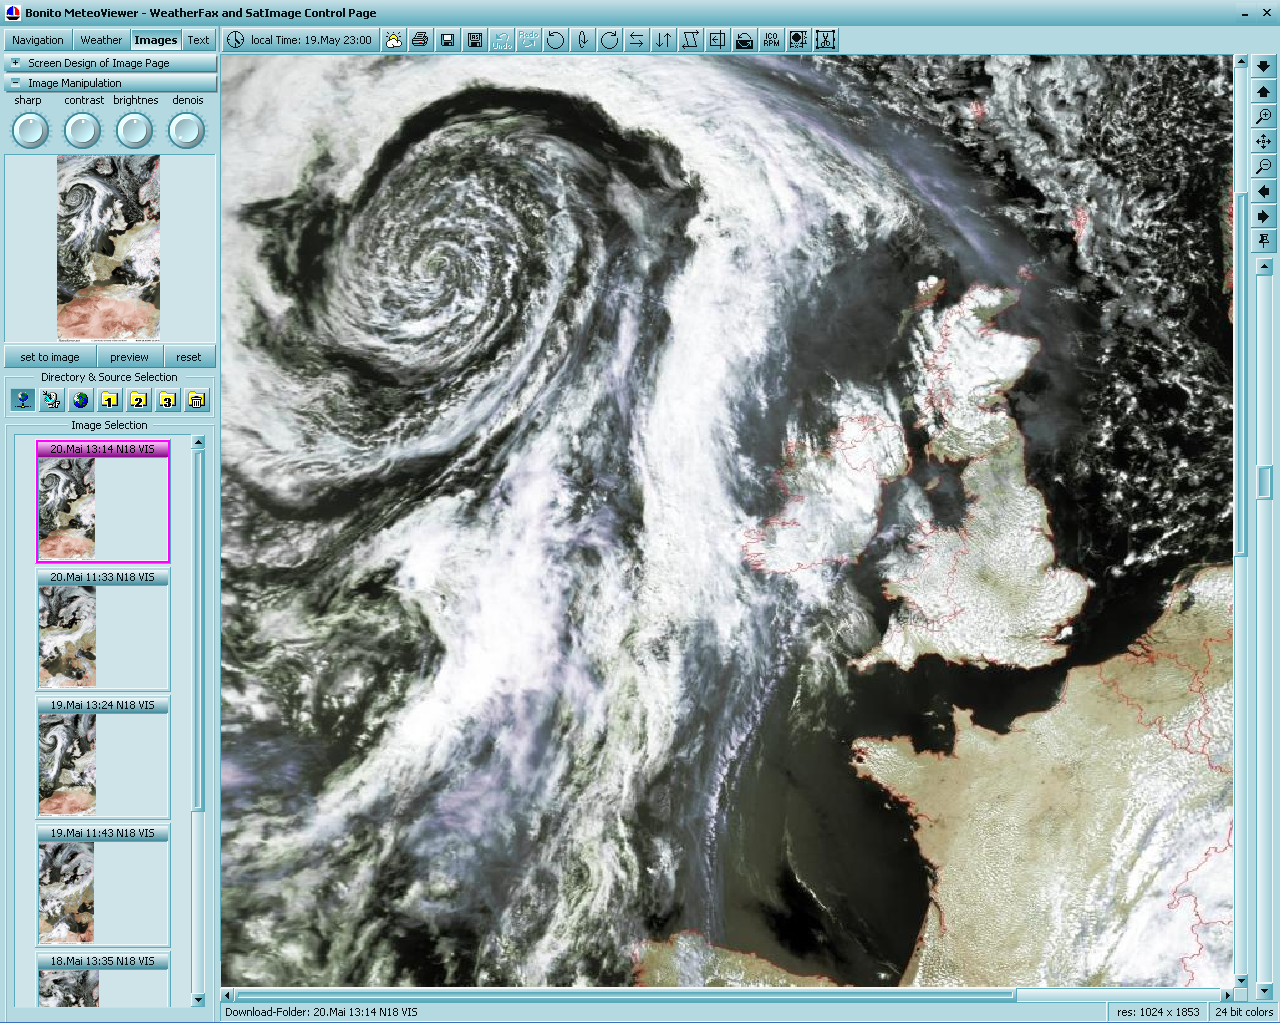
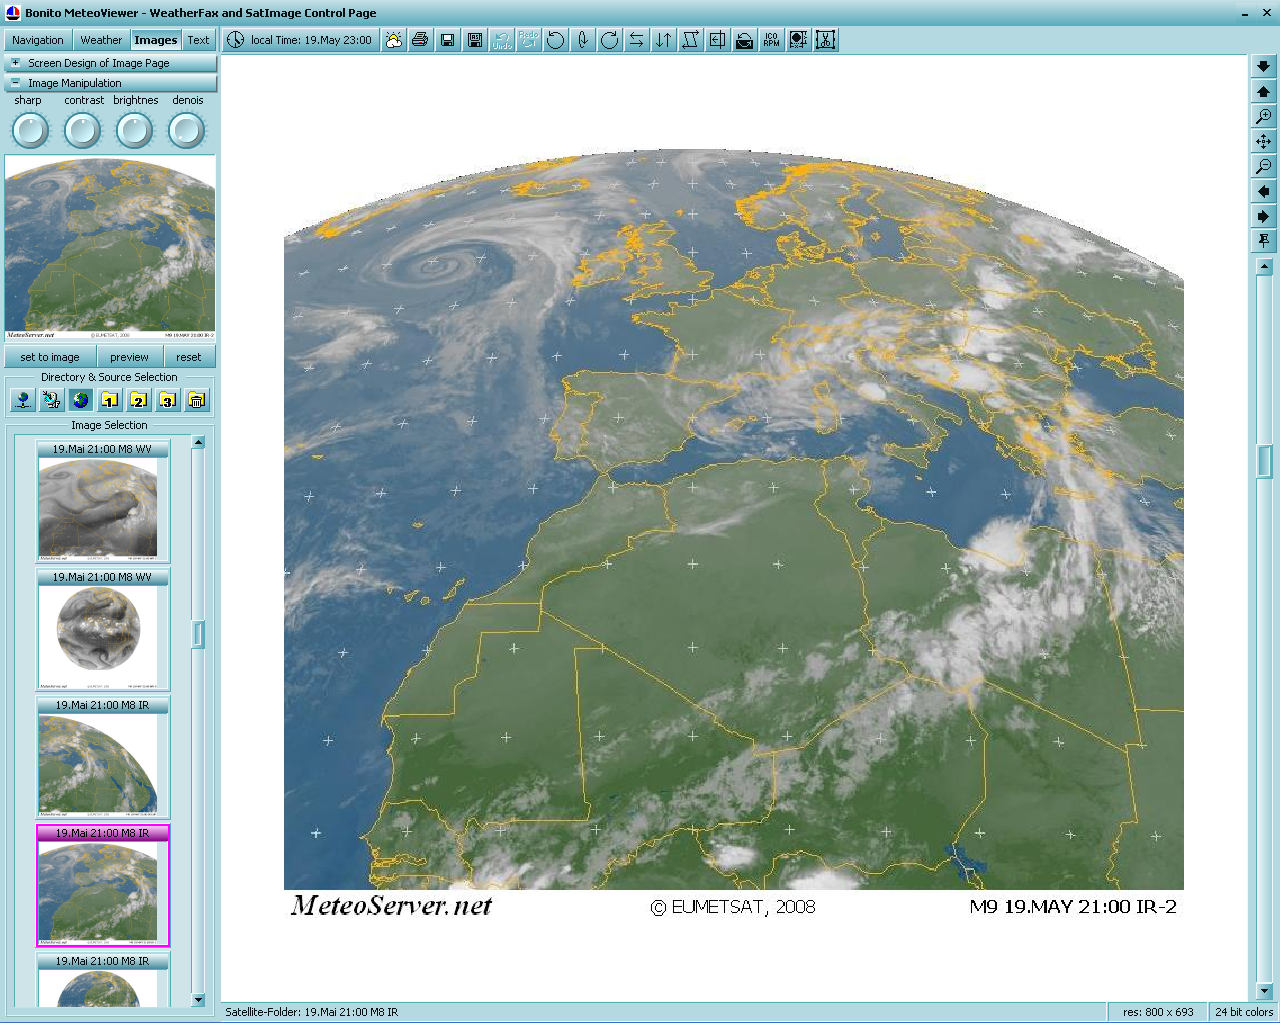
Images

Here you can look at the pictures or process them,
that where loaded from the internet via MeteoServer or by weather
fax from a radio. The use is self explanatory.
There is a special section for series satellite
pictures that can be used for an animation.

The most exciting is the animation. The future
weather is displayed as a film on your screen. While you can
change the display by zooming or shifting. Most noticeable is the
special type off animation. A special image transformation makes
it possible for a brilliant display off the slide show. This has
up to now never been achieved.
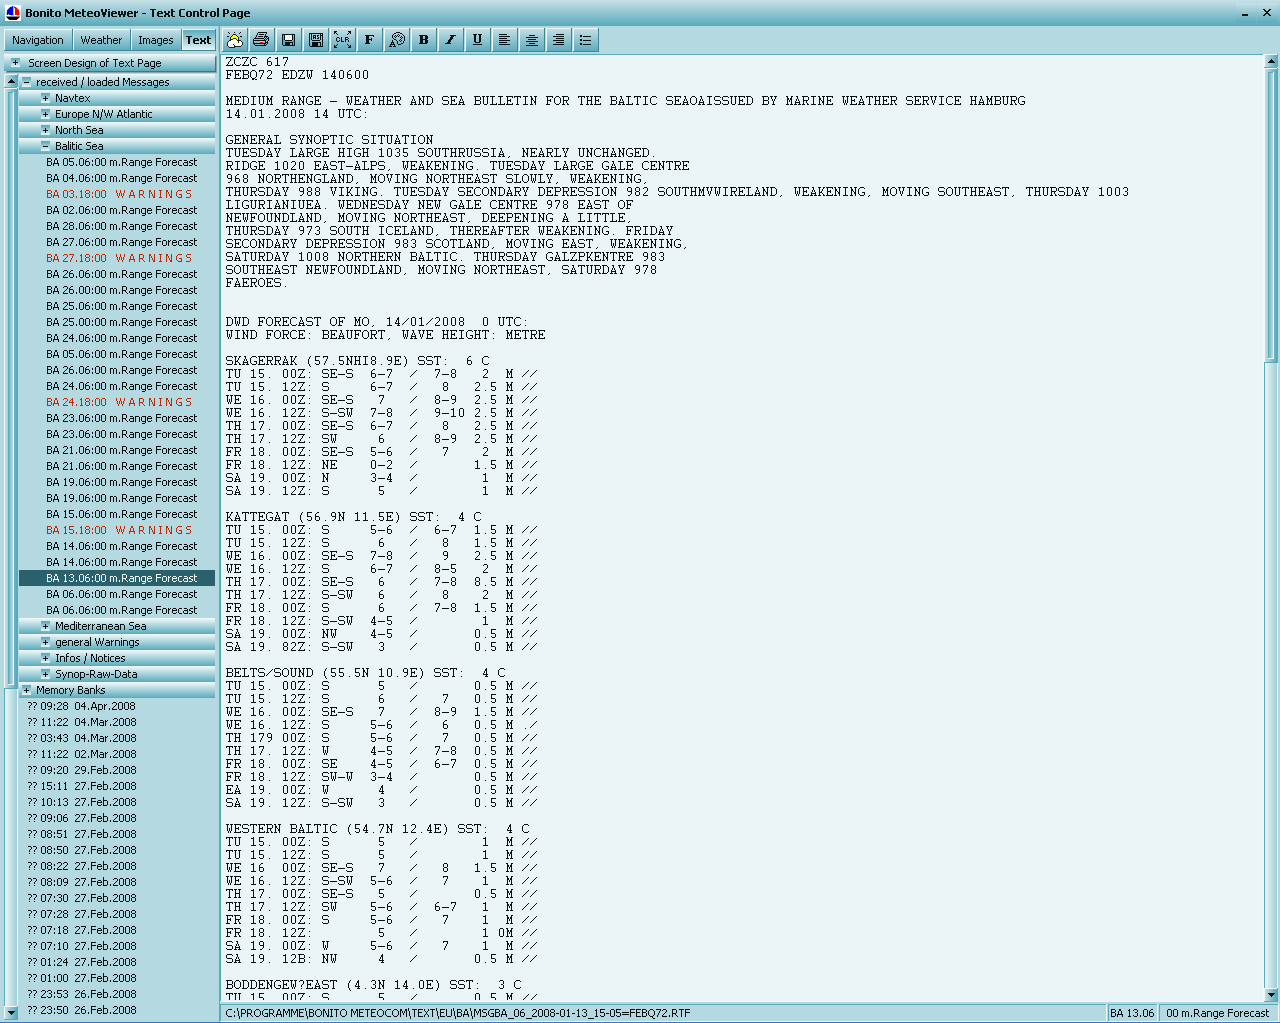
Text

Text such as weather reports and are normally received by radio
sorted and placed in the appropriate folders, so that you do not
have to look through all messages to find a certain Atlantic
report these text can come from Navtex or RTTY. They are normally
called Telex Teletype or RTTY. Navtex is a special Telex type
that is received every 4 hours and warns about navigation
problems or send weather reports. Additionally some text is decoded and transfered into a world map. |